هل تحتاج إلى خطة اختيار أو تغطية لمشروعك؟
إرسال السيناريو والمنطقة وكثافة العميل؛ يرد فريقنا بمقترح التكوين خلال 24 ساعة.
إرسال الاستفسارWhat does a WiFi site survey actually have to prove?
A site survey answers three questions before any money is spent: where the radio has to sit (coverage), how many clients each cell carries at the busiest hour (capacity), and what is already in the air fighting the design (interference). A heat map answers only the first of the three, which is why designs that stop at a heat map still end in complaints.
The survey is a measurement, not a drawing. You walk the space with the device your users actually carry, log signal, noise and channel use at the height people sit at, and only then fix the point count. Everything downstream — cable routes, switch port count, PoE budget, channel reuse — is derived from those numbers.
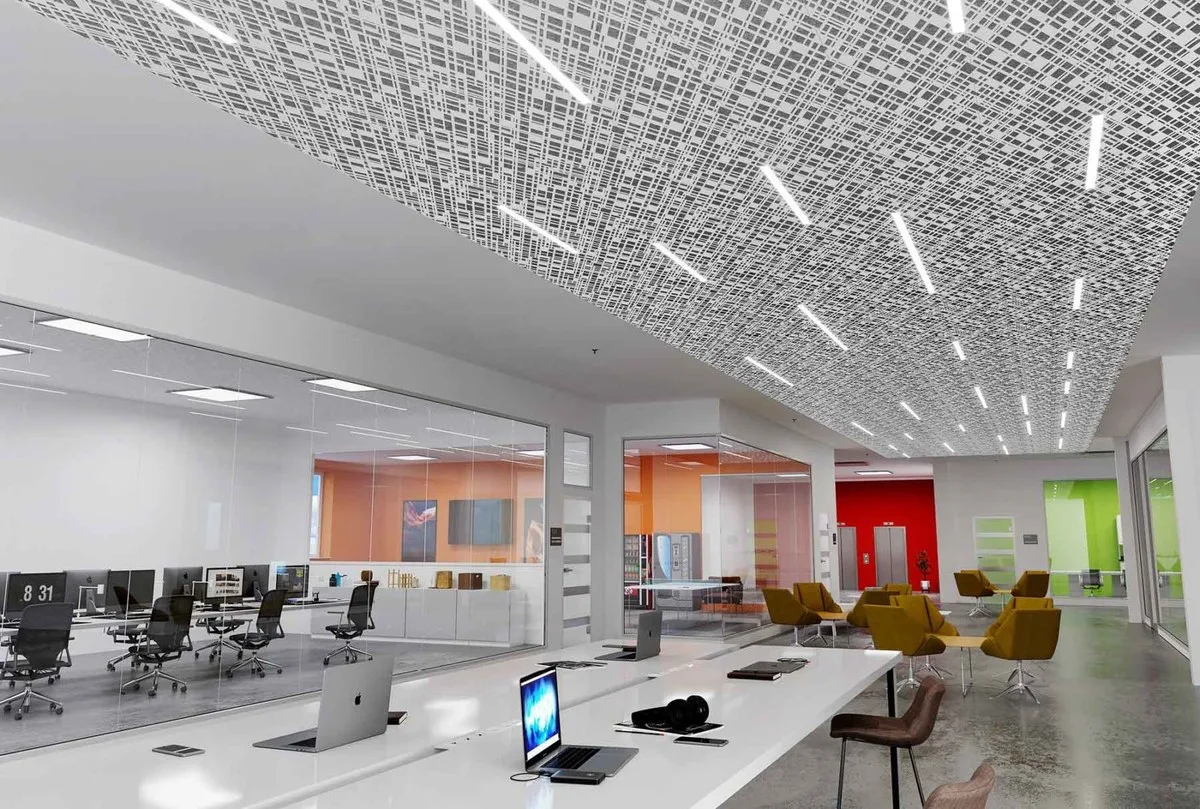
Predictive, passive or active: which survey do you need?
Three different things get called a site survey, and mixing them up is why a project skips the one that would have caught the problem. Only an active walk test answers whether the terminal can actually run video at the farthest seat.
| النوع | When it runs | What it produces | What it cannot tell you |
|---|---|---|---|
| Predictive (floor-plan modelling) | Before installation, from drawings | First point count, a first channel plan, a basis for the quote | Live interference, racking and obstructions above the ceiling |
| Passive survey (listen only) | Before or after installation | Noise floor, neighbouring SSIDs, channel utilisation, non-WiFi interferers | How a real client behaves under load |
| Active walk test (associated, traffic running) | Before the positions are frozen | Throughput, latency, loss, retries and the exact handover points | Anything outside the walked area is unmeasured |
| Post-installation acceptance test | After the APs are live | A pass or fail against the agreed thresholds, plus a deviation list | It does not replace the pre-install survey; it only proves the outcome |
Which numbers count as a pass?
A pass number must be agreed before the first measurement, or the handover conversation is about opinions. The first four rows below are acceptance targets we publish on our own solution pages; the last three are planning targets to confirm against your tool and application.
| What you record | Passing value | Why it decides anything |
|---|---|---|
| 5GHz signal at the main usage point | ≥ -65 dBm | Below this, video and voice start to retry |
| 5GHz at the worst spot (bedside, far seat, back aisle) | ≥ -70 dBm | Complaint tickets come from the worst spot, not the average one |
| Farthest seat in a meeting room | ≥ -67 dBm | Screen sharing and calls run at the far seat, not at the door |
| Signal at the handover point | ≥ -75 dBm | Below it the client is sticky and the handover is a dropout, not a handover |
| Noise floor | -85 dBm or lower | A raised noise floor eats SNR without moving the bars |
| Channel utilisation at the busy hour | Below 50% | Tells you whether the cell has to be split |
| Loss and retries on a five-minute call walk | Loss below 1%, retries below 10% | The only end-to-end test a user actually feels |
How do you walk the building without fooling yourself?
The same software can produce a beautiful heat map and an opposite conclusion. The difference almost always sits in three details: the height you measure at, the state the space was in, and whether roaming was tested with traffic running. These eight habits are what we repeat to every site.
- Measure at seated height (about 1.1 to 1.5 m), never at ceiling height
- Use the device users actually carry; a laptop with a large antenna flatters the result
- Close the doors that will be closed in service; a survey through open fire doors describes a different building
- Walk a grid rather than one line down the corridor; take the corners and edges of every room
- Assess 2.4GHz and 5GHz separately; a 2.4GHz pass says nothing about 5GHz
- Look one floor up and one floor down; a co-channel AP a slab away still contends
- Re-test at the busy hour with real traffic, then walk a five-minute video call on one device
- Photograph every intended mounting point and note the cable route to it
Where do the APs actually go once the numbers are in?
The survey says where the radio has to sit; it does not say which housing fits there. That is a mounting question, and it has a different answer for a guest room, an open floor, a corridor and a yard. The table maps the four to models we actually ship, with rates, antennas and consumption taken from the product pages.
| Space | Mounting the survey points to | Models (published values) | What decides it |
|---|---|---|---|
| Guest room / dorm room | In-wall panel, reusing the 86 box already in the room | WA-590: 3000Mbps, built-in 2 x 2.4G + 2 x 5G antennas, 86 x 86 x 40mm, 48V PoE. WA-580: 1800Mbps, same size and supply | The radio has to stay inside the room |
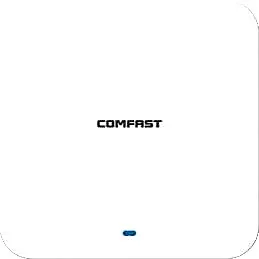
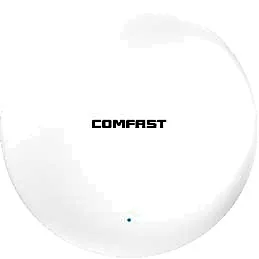
| Open office / lobby / classroom | السقف | CF-E593AX: 3000Mbps, built-in 2 x 3dBi, IP31, <12W. CF-E391AX: 3000Mbps, built-in 4 x 3dBi, 2.5G RJ45 uplink, <13W | Clients per cell, and whether the uplink saturates first |
| Corridor / low-density back of house | Ceiling, power turned down | CF-E390AX: 1800Mbps, built-in 3dBi, IP31, <12W | Density, not transmit power |
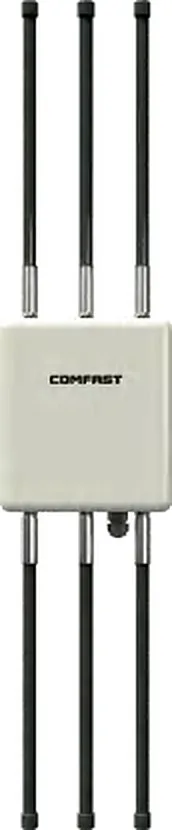
| Warehouse / yard / car park | Outdoor housing, IP66 or IP67 | CF-WA933: IP66, built-in 5 x 4dBi, <18W. CF-WA937: IP67, external 6 x 8dBi, <24W | Protection class and antenna gain set the radius |
What has to be handed over with the survey?
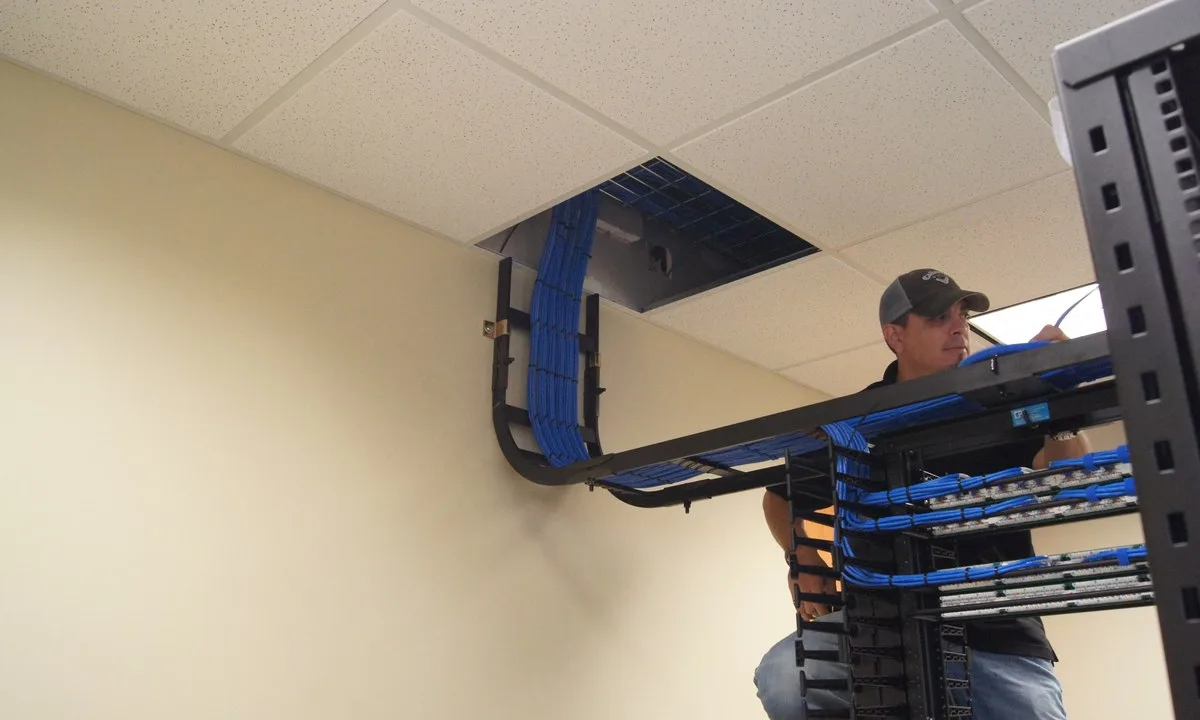
A survey that exists only as screenshots on an engineer laptop cannot be used for procurement. What has to leave the building is a document a cabling contractor and a purchaser can both work from.
- A floor plan per level with every point marked and numbered to match the bill of materials
- Each planned channel and width drawn as a reuse map, with 2.4GHz limited to 1, 6 and 11
- The PoE budget: published consumption plus 15 to 20 percent headroom, matched to port count and total switch budget
- Cable routes and closet port counts, noting which points reuse an existing 86 box
- Signed-off acceptance thresholds, so handover is a measurement, not a discussion
- A photo of each mounting point with its cable path, taken on the survey day
What should you send with the survey data?
Send the survey results and the floor plans and we return a point schedule with models, quantities and the PoE total, rather than a unit price with no context.
- Floor plans per level with room numbers, corridors, meeting rooms and racking layout
- Wall construction and ceiling height (concrete, block or stud), plus door type
- Room count and devices online per room and per seat at the busy hour
- Existing cable category (Cat5e or Cat6) and whether 86 boxes are already in place
- Whether outdoor or car-park coverage is required, and whether power is already there
- الكمية والسوق المستهدف والاعتمادات المطلوبة
الأسئلة المتداولة
How long does a WiFi site survey take?
Density sets the schedule, not floor area: one open office floor usually takes a full day including the walk and the maps, while a 200-room property generally takes two to three days, because every room has to be measured at the bedside rather than from the corridor. Send the floor plans and we will schedule it by point count.
Can accurate floor plans replace the on-site walk?
No. Floor plans do not show ducting above the ceiling, metal racking, film on glass partitions or the neighbouring APs. Predictive modelling is good for a first draft and a quoting basis; the final positions need on-site data, otherwise problems found at acceptance have nowhere left to be corrected.
Do I have to survey 2.4GHz as well as 5GHz?
Yes, and the conclusion is usually the opposite. 2.4GHz has only three non-overlapping channels (1, 6 and 11) and neighbours use the same three, so treat it as a fallback band at low power; 5GHz is the band that carries the business. Surveying 5GHz alone misses the scanners, PDAs and legacy devices that only run 2.4GHz.
We already have a network — is a survey still worth it?
Yes, but the method changes: document the current state first (models, positions, channels and widths, power, SSIDs and bands), then run a passive survey for noise and co-channel use, then an active walk test to find the capacity limit. Change one variable at a time, or a fault after the change cannot be attributed.
What if a figure I need is not published on the product pages?
Every rate, antenna gain, protection class and consumption figure in this article comes from the corresponding product page. Where a value is not published, such as per-unit consumption on the WA series, ask for that model datasheet. We do not fill the gap with an estimated number.